Calculator User's Manual
Updated: January 15, 2018
Introduction
Grounded Solutions Network created the Inclusionary Housing (IH) Calculator to help advocates, policymakers and other interested stakeholders understand the economic issues involved in designing an inclusionary housing policy. The IH Calculator is a simple on-line development pro forma which allows users to model a real or hypothetical development project and then add affordable housing requirements in combination with different development incentives. In this way users can get a sense of what might be economically reasonable for a given jurisdiction trying to set inclusionary housing requirements and offer developers meaningful incentives.
This manual provides a general introduction on how to use the IH Calculator and provides guidance on basic real estate terms and key assumptions. As with the Calculator itself, this manual is meant to provide general guidance and is not a replacement for professional financial feasibility analysis.What is the calculator useful for?
The Inclusionary Housing Calculator is both a teaching tool for illustrating the economic principles that are relevant to inclusionary housing, and a practical analytical tool for understanding the feasibility of requiring different types of community benefits (e.g., inclusionary housing) for a specific project. The Calculator also provides users with a menu of different hypothetical project types to provide a starting place for understanding the feasibility of inclusionary requirements in the context of these prototypes.What should the calculator not be used for?
The Calculator should not be used a replacement for a detailed financial feasibility analysis prepared by a trained urban economist. The Calculator can put users in the “ball park” of what might be economically reasonable for a specific project or policy, but it does not replace the need for careful background market analysis to thoroughly vet assumption, nor does it provide the in-depth training needed to integrate those assumptions into a development pro forma.What methodology does the calculator use?
The IH Calculator is built off of a “static” pro forma, meaning that it takes a look at a single point in time in the future at stabilized occupancy for rental developments and at the completion of initial sales for for-sale developments. The calculator is not a multi-year cash flow, which is another type of pro forma often used by developers, investors and real estate development consultants. A cash flow model is likely to be more accurate but it is much more complex to set up.Who should use the calculator?
Anyone who's interested in testing some assumptions on a development prototype to see if an inclusionary affordable housing requirement would work can use the calculator. This includes city or county staffers, housing advocates, elected or appointed officials, and any average citizens interested in trying to increase the supply of affordable housing in their communities.Which inputs make the most difference?
There are just a few inputs that make the greatest difference to the bottom line results of the Calculator:- Average per square foot hard construction costs. Usually between 60 and 70 percent of development costs can be attributed to materials and labor, so this assumption drives most of the cost side of the equation.
- Average rental rates or sales prices. Average monthly rental rates for rental projects and average sale prices for for-sale projects are the most important assumptions on the revenues side of the equation.
- Capitalization rates. For rental projects, even small changes in the “cap rate” can make a big difference in terms of the profit calculation since this variable is used to translate net operating income in stabilized year into total project value.
Getting better data to refine the estimates
The best source of data is usually a recent development pro forma for a comparable project to the one that is being tested using the calculator. Developers sometimes share these with cities or counties as part of development negotiations if the local jurisdiction is involved in the transaction through a land sale, the provision of subsidy or some other type of public involvement. Otherwise it can be hard to get developer pro formas since many developers consider these proprietary. If consultant feasibility studies are available, these can also be a helpful source of information about both cost and revenue assumptions.When to seek professional advice?
When communities are unsure how to structure a new inclusionary housing policy or rework a policy that isn't yielding results, Grounded Solutyions recommends that communities seek professional advice from an urban economist specializing in this type of analysis. Typically, it's best to issue a request for proposals (RFP) to get the best thinking and most competitive price from a number of consultants interested in doing this type of study.Inputs
Project
Description
Base Units
For projects that include a ‘density bonus’ this is the number of units before the bonus. You can add bonus units by adjusting the ‘density bonus’ slider under incentives. That will increase the number of units to a total that is higher than the number of ‘base units’ entered here.
There is no typical number of units but there are typical numbers of units per acre. Detached single family homes can be as low as 1 or 2 units per acre, while high rise buildings can include more than 100 units per acre.
The Lincoln Institute for Land Policy has a helpful tool, Visualizing Density, that illustrates the number of housing units per acre for many common housing types. (datatoolkits.lincolninst.edu/subcenters/visualizing-density/tour/t4.aspx)
Make sure that the number of housing units (Base Units) is appropriate for the size of the parcel. The calculator shows the units per acre in an info box in the right panel.
If you set the Site Area to 1 acre, it is easier to understand the density of your project because whatever you include for the number of units is also the number of units per acre.
Site Area
If you are unsure of the parcel size, you might want to assume a 1 acre site. Make sure that the number of housing units (Base Units) is appropriate for the size of the parcel.
The Lincoln Institute for Land Policy has a helpful tool, Visualizing Density, that illustrates the number of housing units per acre for many common housing types. (datatoolkits.lincolninst.edu/subcenters/visualizing-density/tour/t4.aspx)
Parking Ratio
The calculator asks for the cost of building parking spaces under Development Costs. In addition, under Incentives there is a slider to lower the parking ratio by a given percentage.
Some buildings will have as many as 2 parking spaces per housing unit but, increasingly. builders are including fewer parking spaces. Because parking spaces are expensive, particularly in higher density buildings, lower parking ratios can dramatically reduce the cost of a building and make it more profitable.
Common Area
This is the portion of Building Dedicated to Common Area. Space within a residential building is generally put into two categories: individual units and common areas. Common areas include hallways, lobbies, community rooms and other common spaces not inside of individual residential units. Common areas are measured by the total percentage of a building’s square footage, which meets this description.
A typical common area range for most residential buildings in the US is from 10 to 20%.
Recently developed projects in the local area are the best place to look. These projects will help you to understand what common area percentage to use. In some type of buildings, larger community spaces are more popular. In areas where land is expensive, developers try to maximize the amount of space they can rent or sell in the form of individual residential units.
Commercial Space
Commercial Rent
You can find commercial rents by speaking with a commercial real estate broker. In some communities, it is more common to talk about commercial rent per foot per year. In those cases, you will have to divide by 12 before entering the rent into the calculator.
Other Rental Income
Unit Mix
Different developments will commonly have different unit mixes. For example, a single family home subdivision will tend to have 2, 3 and 4 bedroom units while an urban mid-rise apartment building may be mostly studio and 1 bedroom units.
Unit Specifications
Average unit sizes for a building vary because of market preferences and locations. In general, you can assume:
o 500-750 square feet for a studio unit,
o 600-850 square feet for a one-bedroom unit,
o 750-1,000 square feet for a two-bedroom unit, and
o 1,000 square feet and more for three- and four-bedroom units.
Websites like Trulia.com and Zillow.com provide listings of currently renting or selling units in your local area. These listings can help find average unit sizes. The best source of information is usually a developer or market analyst. They will have current information on what types of units are most popular in the local market.
Average Market Rent
You can adjust the average either by changing the Average Rental Rate Slider or by changing either the rents for each type of unit or the number of units of each type under Unit Specifications.
There is no typical average rental rate. Market conditions differ from place to place. The rental rates used in the Calculator are for actual developments in three market scenarios:
• strong (ex. San Francisco, New York City),
• mixed (ex. Denver, Salt Lake City, Chicago), and
• weak (ex. Detroit, Cleveland).
The best source of rental rate information is usually a developer or market analyst. These individuals often have current information on trends and comparable projects. Websites like Trulia.com and Zillow.com can also provide listings of current market rents in your local
Data Sources:
• Trulia provides for-sale and rental housing market data in an accessible and easy to use format. Trulia data should be used with caution as it is not always current or comprehensive. (trulia.com)
• Zillow provides estimates of housing market data for free through an easy to use on-line format. Like Trulia, it should be used with caution as the data is not always current or reliable. (zillow.com)
• HUD collects rental housing data for both small and large markets. When other sources are not available, HUD’s 50% percentile rent estimates are a good place to start.(www.huduser.org/portal/datasets/50per.html)
• Real also provides current rental housing market data based on their proprietary database of large professionally managed apartment complexes in major US markets. (www.realanswers.biz/real-research.html)
• NAHB/Wells Fargo Home Price Index provides for-sale and rental housing market data in an accessible and easy to use format. This index should be used with caution as the data is not always current or comprehensive. (www.nahb.org/en/research/housing-economics/housing-indexes/housing-market-index.aspx)
Average Sales Price
You can adjust the average either by changing the Average Sale Price slider or by changing either the rents for each type of unit or the number of units of each type under Unit Specifications.
There is no typical average sale price for either detached units or units in a condo building. Market conditions differ across the country. The sale prices used in the Calculator are for actual developments in three market scenarios:
• strong (ex. San Francisco, New York City)
• mixed (ex. Denver, Salt Lake City, Chicago), and
• weak (ex. Detroit, Cleveland).
As with rental rates, the best source of information is usually a developer or market analyst. These individuals often have current information on trends and comparable projects. Websites like Trulia.com and Zillow.com can also provide listings of current market sales in your local area.
Realtors can also sometimes have a sense of what sale prices are in a given location. Realtors based these estimates on their experience and access to Multiple Listing Service (MLS) data.
Revenue Data Sources:
• Trulia provides for-sale and rental housing market data in an accessible and easy to use format. Trulia data should be used with caution as it is not always current or comprehensive. (trulia.com)
• Zillow provides estimates of housing market data for free through an easy to use on-line format. Like Trulia, it should be used with caution as the data is not always current or reliable. (zillow.com)
• DataQuick collects for-sale market data for most major markets. In some cases this data is available for free through DQ News. (www.corelogic.com/landing-pages/dataquick.aspx)
• NAHB/Wells Fargo Home Price Index provides for-sale and rental housing market data in an accessible and easy to use format. This index should be used with caution as the data is not always current or comprehensive. (www.nahb.org/en/research/housing-economics/housing-indexes/housing-market-index.aspx)
Affordability
Area Median Income
Local housing and community development departments also publish an annual update of AMI levels. These updates are always the best source if available, as the AMI targets might be adjusted according to local housing needs.
This input will be the same for every project in a metro area. You should be able to set it once and never change it until HUD publishes a new AMI the following year.
Homebuyer Mortgage Rate
Regional mortgage rate averages are available at BankRate.com. Some cities have adopted rules for pricing affordable homes which include specific assumptions that should be used here.
Property Taxes
The local property tax assessor (or any local homeowner’s tax bill) is the best source for the local tax rate. The national average for residential property taxes is 1.38%. The Tax Foundation publishes averages for each state. (taxfoundation.org/how-high-are-property-taxes-your-state)

Insurance
Some cities have adopted rules for pricing affordable homes which include specific assumptions that should be used here.
HOA and Other Costs
In 2015 the average HOA fee was $331 but the amount varies quite a bit by type of project and even between different regions.
Trulia tracks average HOA fees in different parts of the country. (www.trulia.com/blog/trends/hoa-fees)
Affordability Standard
For rental housing, the national standard is 30%. This means that a housing unit is considered “affordable” when the occupants pay no more than 30% of their total income on housing costs. For ownership housing (and occasionally in some rental housing programs), the standard is sometimes adjusted up to 33% or 35%.
Local housing and community development departments are the best places for affordability standards. Note, standards can differ between affordable housing programs. Standards are usually available in program documents or from program staff.
Assumed Downpayment
This is typically 3 or 5%.
Some cities have adopted rules for pricing affordable homes which include specific assumptions that should be used here.
Affordability Levels
The most common targets are 30%, 50%, 60%, 80%, 100%, and 120% of Area Median Income. The calculator adjusts the income targets to reflect different household sizes that are expected to occupy each unit size. The calculator assumes 1 person per bedroom plus one. As a result a 3 bedroom unit will rent for more than a 1 bedroom unit even when both are targeting 80% of AMI.
The calculator shows the actual income corresponding to each income level. (Make sure to update the Area Median Income above to the AMI for your area.)
Note, in less expensive markets it is important to be careful not to set affordability targets that are so high that ‘below market’ units are actually priced at or above market rate. Even if they are slightly below market, they may be hard to sell or lease.
Affordable Units Breakdown
Incentives
Developers often receive incentives to include a certain percentage of affordable housing units. The Calculator allows users to adjust the following types of incentives:Density Bonus
Tax Abatement
Streamlined Processing
Fee Reduction
Parking Reduction
Cash Incentive
Development Cost
Construction Costs
Construction hard costs include all construction material, labor, and general contractor overhead. General contractor overhead are hard costs not used in construction (like a temporary office space, or equipment rental.) An extra 15% is often included as a contingency to account for costs above what was estimated.
A “gross” square foot means the total space of all residential units and common area in a building including hallways and other circulation space. Some sources will list construction hard costs per net square foot (NSF). The NSF of a building includes only the space inside the residential units and excludes hallways, and other common areas.
These hard costs do not include expenses like architectural fees or permitting costs. These costs are included in the input for Soft Costs.
Construction costs differ between locations and are not always related to land cost. For instance, some cities, like Detroit, have low land costs but high labor and construction costs. Construction costs also depend on building type. Buildings built with wood-frames are much cheaper than those built with steel-frames. However, steel frames are required for taller buildings for reasons of fires safety.
The following table provides some representative per square foot costs from RS Means:

Detailed construction cost data can be purchased through RSMeans.com. Yet, RS Means estimates can often be very different from the actual costs for real projects. To estimate the cost of construction it is best to find the costs for several projects of similar location, design, and construction type.
Note that the calculator breaks out the cost of constructing parking from the cost of constructing the residential structures. When looking up construction costs in other sources pay attention to whether parking is included. If it is included, you may need to remove parking costs from the total construction cost and enter the result here.
Land Cost
Land costs are measured in dollars per acre. These costs are determined by factors like: how many stories you can build on an acre (zoned density), how much demand there is for land, and landowner expectations.
There is no one typical land cost, even for similar zoned parcels in the same city. In cities like San Francisco or New York, there is a high demand for land and land costs can be as high as $10-$25M per acre. In cities where there is less demand for land, land prices might be $500,000 or less per acre.
The best data is often from companies who buy and sell land. These companies include real estate brokers and appraisers familiar with the local market. Data is also available in real estate market reports called “comps.” These reports written by professional consultants, list land sales of similar types of properties.
Data can also be found in a study of land prices by state published by The Lincoln Institute for Land Policy. (datatoolkits.lincolninst.edu/subcenters/land-values/land-prices-by-state.asp)
Cost Per Parking Space
Parking is one of the biggest costs involved in building multifamily buildings. Parking costs grow in areas where surface parking isn’t possible or desirable. There are several different types of parking in residential and mixed-use buildings including:
o Above-grade parking garages ($20-$35K per space);
o Below-grade or underground parking ($35-$45K per space); and
o The cheapest option, Surface parking ($1,000 per space depending on the site and the landscaping involved).
Like construction hard costs, parking space cost estimates can be purchased through RSMeans.com The best way to get information, though, is to look at similar recent developments with the same type of parking.
Be careful not to double count construction costs for parking. Parking construction costs should be entered here and not included in the hard construction cost input above.
Sales and Marketing Costs
Other Soft Costs
o architectural and engineering costs;
o legal and insurance fees;
o planning approval fees;
o environmental clearance and building permits (also called entitlements);
o development impact fees; and
o Other professional consulting fees or costs not connected to the physical building of the project.
Soft costs range from 20 to 30 percent of hard costs. This range depends on how complicated the project is to design and build and how long the entitlements (planning and permits) process takes.
Developer "pro formas" are a good source for soft costs. Local real estate experts and city planning staff familiar with local development conditions can also help.
Note that the Calculator separately itemizes financing costs, sales and marketing costs, and development impact fees. These costs are often included in soft costs. If you find a source for soft cost information, check to see whether it includes these items, and if it does, subtract them out and enter them separately in those fields.
Other Development Costs
Residential Impact Fees
In more expensive cities, $10,000 per unit and more is typical. In other cities, fees are relatively insignificant or may not exist.
A summary of a jurisdiction’s development fees can often be found online. This summary is often on the Planning or Housing & Community Development department website. Local developers are also sometimes a good source of information based on recent projects that they’ve built.
The Brookings Institution also has published this report on residential impact fees. (www.brookings.edu/~/media/research/files/reports/2003/6/metropolitanpolicy-nelson/nelsonimpactfees.pdf)
Condo Wrap Insurance
Costs vary according to how risky the particular development is and how long the initial sales period is likely to take.
The best sources for wrap insurance are developers and insurance brokers that specialize in wrap insurance. They will be able to provide how much wrap insurance will cost for a given development type and location.
Read more about wrap insurance here: www.ccim.com/cire-magazine/articles/its-wrap/?gmSsoPc=1
Operating Cost
Rental Vacancy Rate
Rental Operating Cost
These costs generally run somewhere between 30 and 50% of income. The difference between different cost assumptions can make a big difference to feasibility.
A 2015 National Apartment Association survey found that the average operating cost for properties less than 5 years old was 35% of income.
Financing
Often projects require multiple sources to finance and create profit for a project. This layering of sources is complex and can be difficult to understand.This section describes several of the main methods used to finance and make profit on a development. To simplify the pro forma analysis, the Calculator assumes a single source of debt (i.e. loans) and also a single source of equity (i.e. existing developer or investor funding).
Construction Loan Interest Rate
Interest rates fluctuate depending on conditions in the national economy. These conditions include the Federal Reserve prime rate, local market conditions, and lender underwriting standards. We’ve seen interest rates anywhere from 4.5% to 8% in recent years, with 4% to 5% being typical in strong market settings in 2015.
Local developers and lending institutions (i.e. banks) will have access to the latest information on construction loan interest rates.
Loan to Cost Ratio
A developer would like to get this number as close to 100% as possible. A ratio of 100% would mean that they were able to borrow all of the cost of developing the project and didn’t have to invest any of their own money (or any equity from investors). Higher ratios (closer to 100%) will result in higher rates of return because the more a developer can borrow the less equity they need to invest. Lenders, on the other hand, prefer to keep the loan to cost ratio well below 100% to provide a safety cushion in case things go wrong.
Typical loan to cost ratios range from 60% to 80%. The ratio can vary due to market conditions, lender underwriting standards, and developer creditworthiness.
Local developers and lending institutions will have access to the latest information on loan to cost ratios for construction loans.
Period of Initial Loan
Anywhere from a year to three years for most developments would be typical. More complicated projects could have longer loan periods.
Local developers, lenders, and sometimes planning department staff are the best sources of guidance for this assumption.
Initial Construction Loan Fee
Points of anywhere from 1% to 2.5% of the total loan are typical. In some markets, fees may be higher along with interest rates. Points will also depend on the creditworthiness of each developer. Creditworthiness is an analysis by a lender of the likelihood a developer will not be able to pay back a loan. A lower creditworthiness would mean a higher Points.
Local developers and lending institutions will have access to the latest information on fees/points.
Average Outstanding Balance
Another way to think of this is, at the middle point in the construction period, how much of the construction loan will have been drawn down. The higher the Average Outstanding Balance, the more the total cost of construction loan interest.
50% to 60% is typical in most cases. Smaller projects with a shorter time frame might have much higher average outstanding balances. This higher balance is because there is less time to draw down the loan.
As with the other assumptions in this category, developers and lending institutions will be the best source of information.
Permanent Loan Interest Rate
Permanent Loan Term
Profitability
Measure of Profitability
Profit Percent of Cost
For example if a project is “worth” $10 million but it only cost $9 million to develop there is a profit of $1 million. The profit of $1 million is 11% of the $9 million cost which means that the developer earned 11% “return on cost.”
One advantage of the Return on Cost measure is that is can be used to compare the relative profitability of rental and ownership projects.
Yield on Cost
For example if a project cost $9 million to develop and has an annual Net Operating Income (NOI) of $450,000 then the Yield on Cost is 5% (450,000/9,000,000).
This is also a very rough measure, but for rental property owners who intend to hold a property, Yield on Cost provides a better measure of profitability than Return on Cost.
IRR
Residual Land Value
Required Profit
Required profit is the profit needed as a percentage of total costs to undertake a project. Below that required profit percentage, developers are unlikely to move forward with a project.
The typical range for required profit is 10%-20%. This range is based on a review of consultant reports and developer pro formas from across the country. In riskier markets, developers and their investors may expect higher profit margins. In stronger markets, lower profit goals are acceptable because higher demand for housing means investors face less risk. The less risk, the lower return an investor will demand.
The best sources for local profit data are real estate experts, market analysts, and local planning and community development staff. They often have an idea of what profit expectations are in the local marketplace.
Individual developers also are a good source of information. But they are sometimes not motivated to share this information.
Required Yield On Cost
Required yield is the yield needed to undertake a project. Below that required percentage, developers are unlikely to move forward with a project.
The typical range for required profit is 4% to 9%. In riskier markets, developers and their investors may expect higher yields. In stronger markets, lower profit goals are acceptable because higher demand for housing means investors face less risk. The less risk, the lower return an investor will demand.
The best sources for local profit data are real estate experts, market analysts, and local planning and community development staff. They often have an idea of what profit expectations are in the local marketplace.
Individual developers also are a good source of information. But they are sometimes not motivated to share this information.
Cap Rate
Cap rates differ between different project types and markets and depending on the level of risk. Nationally, the average cap rate for apartment buildings in 2014 was around 5.5%, according to Integra Realty Resources. (www.irr.com/_FileLibrary/Publication/16/IRR_Viewpoint_2015.pdf)
The range was from 4% to 8% for newly built Class A properties. Stronger markets like San Francisco or New York have lower cap rates, and weaker markets like Detroit or Buffalo have higher cap rates. When in doubt, start with the national average and then make adjustments as needed.
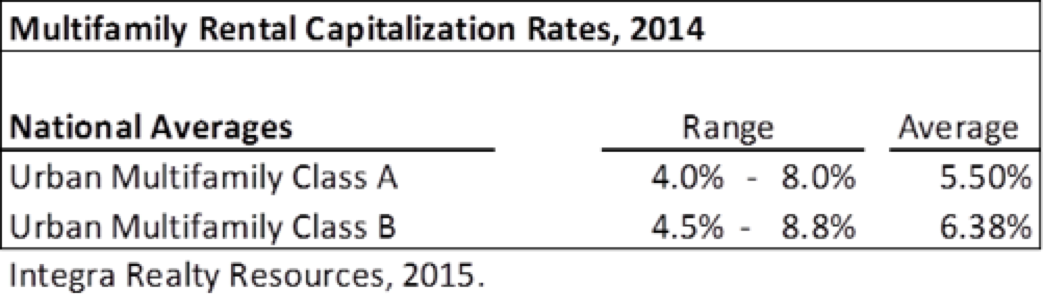
Cap rate data can sometimes be hard to find, and there is often as much art as science involved in setting appropriate cap rates. Integra Realty Resources is a good place to start.
You should also look at local reports from real estate brokers and market analysts to supplement this data. Different brokerage firms will provide alternative estimates of prevailing cap rates. This variation is due to their sources of transaction data and understanding of the market.